Mother’s Day 2012 – Retail Projections Looking Marvellous

Strategy Plan One

May 1, 2012 

Mother’s Day 2012

Are you an entrepreneur in retail and considering sales and marketing opportunities around Mother’s Day?  The National Retail Federation (NRF) has posted statistics and projections for Mother’s Day 2012.  Similar to the patterns of other calendar events in 2012 like St. Valentine’s Day, Patrick’s Day, and Easter, the upward, projected trend is welcoming.

Mother’s Day 2012 – NRF Survey

According to the NRF survey, retail spending is projected to increase 8.4% over 2011 Mother’s Day spending, with total spending for 2012 expected to reach a whopping $18.6 Billion.  The survey data suggests that the average spending per person buying Mother’s Day gifts is now estimated to be over $152.

The following graph, courtesy of NRF, illustrates a favourable, turn-around trend over the past 5 years, with stabilization occurring in 2009-2010, following by significant spending increases in 2011 and 2012.  Let’s hope this trend continues.

  Mother's Day 2012

To make Mom feel the best on her day, here’s the top of the spending list:

  • $3.4 Billion on a brunch or dinner for Mom (54.3% of celebrators)
  • $2.2 Billion on flowers (66.4% of shoppers)
  • $1.8 Billion on gift cards
  • $1.6 Billion on clothing and accessories
  • $1.6 Billion on electronics, tablets, digital cameras (12.7%), and
  • $1.3 Billion in spa treatments and personal services (Ahhh for Moms!)

From the tech perspective, almost 40% of potential shoppers surveyed will scan their mobile devices and tablets for the deal of all deals for Mother’s Day.  About 24% of tablet owners will use their devices for Mother’s Day purchases.  App developers should pay close attention to the increasing trend of utilizing apps in devices to research and purchase products; 12% of device owners will be utilizing apps in this NRF survey, conducted by BigInsight.

Retail Industry – Indicators

As previously reported, the retail and food industry indicators in March showed marked improvements upward.  The US Census Bureau stated a 6.5% increase in retail revenue over March 2011.

retail industry

The projected trends overall in the retail sector and around calendar events for 2012 are very consistent in the 5-8% increase range.  As an entrepreneur and business owner in the retail sector, tune in and analyze some of these trends in the retail industry.

Strategy Plan One

http://strategyplanone.com

Business information, resources and tips for the entrepreneur

Green Strategies – Small Business Survey [Infographic]

Strategy Plan One

April 19, 2012 

Green Strategies

Eco-friendly, green strategies are good for the environment and are also good for business as it helps build solid positive relationships with customers who will make a connection with the green conscious business.  The green environmental sector is big business, with 2011 revenue estimates at nearly $330 Billion.

During February 2012 Office Depot surveyed over 1000 small businesses to gauge information on implementation of green strategies and use of green products across operations.  The small business results in this infographic were surprising, with:

  • 70% to implement green strategies in the next 2 years
  • 61% of small businesses currently implementing green practices
  • 82% having a recycling green strategy
  • 56% learning about green products online
Concerns by small business implementing green strategies and products:
  • 39% concerned with the cost 
  • 21% concerned about lack of green strategy and product options
  • 13% concerned about clarity around going green
  • 13% cite concerns on quality of green programs / products, and
  • 11% state lack of time as a concern

green strategies

Source:  BusinessWire


Strategy Plan One

http://strategyplanone.com

Business information, resources and tips for the entrepreneur

© 2012 Strategy Plan One

Color and Design – Factors Influencing Commerce [Infographic]

Strategy Plan One

April 14, 2012 

Color and Design

Many factors influence how, when, where and what we buy in the marketplace.  Marketing plays a key role in tapping into these cues, and utilizing them out front to build a more richer, more powerful message to the consumer.  Making the powerful message resonate with the consumer more will result in a deeper connection, relationship and eventually sales and revenue.

This infographic from KissMetrics digs deep and illustrates color and design, and other factors that influence our purchase decision-making process.

Color and Design Facts

Interesting facts to note from this infographic on color and design influences:

  • 93% of consumers place visual appearance as the primary factor in purchasing
  • 85% state color as the primary visual factor
  • Color influences brand recognition by 80% (confidence factor)
  • Online shopping – 42% based an opinion of a website on its overall design
  • Webpage load time factor / correlation:  longer load times result in decreased sales
  • Different colors have different effects/purposes: Blue – security/business, Red – Sales, Yellow – optimistic/youth

color and design

When developing your marketing plan and marketing activities, use the appropriate color and design for maximum impact and benefits.  You may have to complete some market testing with color and design in your products and services.


Strategy Plan One

http://strategyplanone.com

Business information, resources and tips for the entrepreneur

Credit Card Statistics and Payment Impacts [Infographic]

Strategy Plan One

April 11, 2012 

Credit Card Statistics

Credit card debt in the US is a significant portion of consumer debt, amounting to almost $2.00 Trillion in debt.   That figure is staggering considering that the Federal Financial Budget in the US is approximately $2.5 Trillion annually.

Courtesy of CreditDonkey.com this infographic illustrates consumer credit card statistics, consequences of varying levels of payments on credit cards, and credit score impacts.

Highlighting some of the credit card statistics:

  • 156 Million credit card holders
  • 54 Million households with credit card debt
  • 1.25 Trillion credit cards issued
  • $1.994 Trillion total credit card debt
The infographic below includes the impacts of varying levels of monthly payments on the credit cards, raising the facts that higher principle payments result in a shorter duration to payoff credit card debt and less interest charges.

Credit card statistics

Source – Credit Card Statistics Infographic – Creditdonkey.com

Strategy Plan One

http://strategyplanone.com

Business information, resources and tips for the entrepreneur

© 2012 Strategy Plan One

Baseball and Social Media Facts and Stats [infographic]

Strategy Plan One

April 5, 2012 

Just like any other industry, social media is deeply integrated into professional sport marketing.  With billions of social media users, sport is frequently mentioned, liked and followed across Facebook and Twitter.  Social media is a marketing strategy must for messaging business product and services to a mass audience.

Produced by Banyan Branch, this infographic illustrates facts and statistics of Major League Baseball on social media sites.

Some interesting social media facts and stats (as of March 28, 2012) :

  • Yankees are the most popular team on social media (5.3 Million Likes; 550,000 Follows)
  • American League edges out National in Facebook discussions (53% and 47% respectively)
  • Nick Swisher – Most Followers (1.48 Million Followers)
  • C.J. Wilson – Individual Player All Star Tweeter (12,917 Tweets)
  • Giants – Team All Star Tweeter (18,000 Tweets)

Source:  Banyan Branch

Strategy Plan One

http://strategyplanone.com

Business information, resources and tips for the entrepreneur

© 2012 Strategy Plan One

Social, Mobile, Cloud Gaming – Trends in the Video Game Industry

Strategy Plan One

April 3, 2012 


video game industryVideo Game Industry

Social media, online, streaming, and new platforms are all factors that play into the rapidly changing video game industry.  Many video game industry strategies are continuing to build on trends around social media sites, development of new tablet, mobile, handheld and console devices, and faster streamlining internet connections.


Posed to be a $65-80 Billion industry per year in 2012 and 2013, the emphasis in the video game industry continues on developing apps and games for mobile devices, while still not losing focus on console gaming with PS4 and Xbox 720 slated to début late 2013 or early in 2014.


Social Gaming

Building off the social gaming successes of companies like Zynga and Playfish, developers will continue to tie into the building user base of social media sites, now well over 1 Billion users.  However, users and developers are aligning for a far richer, deeper social gaming experience.


Last December, Zynga approached a $1 Billion valuation based on valuation tied to the hundreds of millions of social media users who flocked to their “free” games.  Zynga is one of those companies that speculated around revenue generation of a massive base of users.  Solid revenue generating models are developed once companies reach this stage to give assurances to investors.  In most social gaming sites, significant revenues are generated from advertising, rather than pay per use for gaming, and those models will be changing.


Offering More Free Access / Micro Payment Models

The movement is not away from free access, but more towards more free.  The objective of many online entertainment gaming companies is to accumulate as many users as possible, and thus, valuation of these sites increase.


Revenue models from gaming companies now include “pay by extra-feature”, or added features by subscription.  These tactics, sometimes referred to as “micro-payment” models tap into a user market willing to pay a very low monthly fee for gaming access.


Valuation of website inclines with the number of unpaid or paid subscribers.  The economic and business value of high volumes of potential consumers is prized by investors.


video game industryMobile Gaming Will Dominate

The mobile and tablet gaming industry is increasing at a good pace, with reference to Nielsen’s annual U.S. Gaming: A 360° View survey (March 2012).  Marketing research firm M2 Research is predicting that the mobile gaming market will blow past the $6 Billion mark in 2012.


The use of mobile platforms will continue to grow at alarming rates.  2012 will see the app and game market develop around the new iPad 3, Sony’s PS Vita, and many mobile devices utilizing the Android operating system.


Android Operating System (OS) gaming is dominated by users in the 25-34 age brackets.  Android is gaining massive strides as the dominate operating system for mobile smart phone and tablet devices.  By February 2012, 450,000 apps were available for Android.   iPhone gaming has appeared to be penetrating evenly across all age segments.


Cloud Gaming

Cloud gaming, which is essentially “Gaming on Demand”, will continue to build in 2012, as it makes it easier and faster for all gamers to connect from any type of mobile to console device.   Cloud streaming gaming is considering similar along the lines of streaming movies.  Here is a YouTube video on Cloud Gaming and its appealing direct, instant streaming features to video game enthusiasts.


The gaming industry will generate much interest over the next few years.  Entrepreneurs, developers, and businesses in the industry should keep a frequent eye on the rapidly changing gaming landscape.

Strategy Plan One

http://strategyplanone.com

Business information, resources and tips for the entrepreneur

© 2012 Strategy Plan One

2012 Tax Freedom Day in the US …. April 17

Strategy Plan One

April 2, 2012 

From the Tax Foundation, here is a calendar highlighting that US citizens must work an average 107 days into the calendar year to reach the Tax Freedom point.  It illustrates what proportion of your work year goes straight to taxes.

tax freedom

Courtesy of taxfoundation.org

Strategy Plan One

http://strategyplanone.com

Business information, resources and tips for the entrepreneur

© 2012 Strategy Plan One


Oil Prices & Impacts on the US Economy and YOU [Infographic]

Strategy Plan One

April 1, 2012 

The price of crude oil, and consequently the price of everything, is rapidly increasing.  This infographic, courtesy of fuelfreedom.org highlights the impacts of oil prices.

Some fact and impacts of oil prices:

  • 10 out of the last 11 recessions occurred after an increase spike in oil prices
  • $330 Billion – US net outflow for foreign oil
  • Economists projecting 2012 to have the highest gas prices in history
  • Estimation of up to $200 per barrel of oil if Iran relationship worsens
  • Highest impacts would occur to lower – middle income earning families

Time for increased emphasis on alternative energy sources and technologies?  You bet.  Tough economic times an challenges such as these open the doors further to business opportunities around alternatives and green clean energy.

infographic

Strategy Plan One

http://strategyplanone.com

Business information, resources and tips for the entrepreneur

© 2012 Strategy Plan One

Hopping US Retail Statistics Around Easter

Strategy Plan One

March 31, 2012 

The National Retail Federation (NRF) has released some estimated retail statistics for US consumer spending in the 2012 Easter period.   This could be noted as more positive economic indicators, with projected spending to increase for this year’s season.  Retail entrepreneurs and business owners should tune-in to lucrative events in the annual calendar, as all pose to be potentially lucrative if you tap into some niche retail areas.

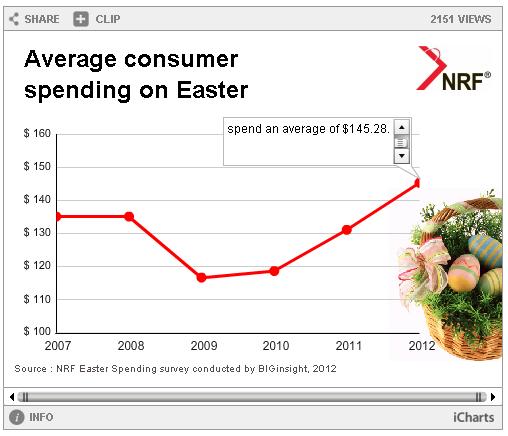
Here are some highlights on 2012 estimated US retail spending around Easter, based on a NRF survey:

  • Estimated average spending on retail merchandise, food, candy: $145.28
  • 2012 estimated average spending is up by +11% over 2011 ($131.04)
  • Total estimated retail spending for Easter 2012:  A big $16.8 Billion

Easter Calendar - spending

Here are the biggest categories in a breakdown of the estimated retail spending around Easter 2012:

  • Fashion & Accessories:  $3.0 Billion
  • Easter Candy:  $2 Billion
  • Easter meals & food:  $5.1 Billion
  • Easter gifts & cards:  $2 Billion

It is interesting to note that the average estimate spending is $44.34 for Easter meals, $20.57 for Easter Gifts, $10.50 on flowers, $9.07 for Easter decor, and from the half that buy greeting cards, an average of $7.04 on greeting cards.

Easter Shopping

Some interesting trends are highlighted in this NRF survey around how and where consumers will shop:

  • 63.5% will shop at the local discount store
  • 42.6% will shop at a department store for gifts; highest percent in the survey’s history
  • 8.7% will shop online, represents a 4% increase over last year
  • 25.4% will shop at a specialty retail store

Similar to other calendar events, Easter consumer retail spending can bring significant revenues to your business, if you target customers in niche areas.  If you are in retail in these areas, do not overlook the power of retail during special periods.  Plan well in advance for periods of retail opportunities.

Strategy Plan One

http://strategyplanone.com

Business information, resources and tips for the entrepreneur

© 2012 Strategy Plan One

Mommy Blogger Domination [Infographic]

Strategy Plan One

March 29, 2012 

The big business world of Mommy Blogging is illustrated brilliantly in this infographic below, courtesy of infographicsarchive.com.

Mommy blogger huge numbers:

  • 4.2 Million Mommy bloggers and growing  
  • 33% of bloggers are Moms
  • Social Media – 79% of Moms are active on social media
  • Over 81 Million women active in social media on a weekly basis
  • US Moms spend $2.1 Trillion per year

mommy blog

Strategy Plan One

http://strategyplanone.com

Business information, resources and tips for the entrepreneur

© 2012 Strategy Plan One