Construction Industry – April 2012 Economic Statistics Continue to Climb

Strategy Plan One

June 5, 2012 

Construction Industry – April 2012

US Census Bureau Statistics from the construction industry continue on a favorable trend, now estimated to be $820.7 Billion (seasonally adjusted annual rate) for April 2012.  This is significant up from the month of April 2011 with an increase of 7.3% over that month.  It also represents an increase of 0.3% over the March 2012 figure of the $818 Billion seasonally adjusted annual rate.

These are good economic indicator signs, with the construction industry steadily improving for three consecutive months, and follows favorable statistics released on residential construction and residential sales.

construction industry  - april 2012

The biggest gains occurred in the residential construction sector, growing at 2.6%.  However, non-residential construction represents the majority of construction.

Articles and blogs on economic indicators:

Construction Industry News


Strategy Plan One

http://strategyplanone.com

Business information, resources and tips for the entrepreneur

© 2012 Strategy Plan One

Construction Spending – Construction Industry on the Rebound?

Strategy Plan One

April 13, 2012 

Construction Spending

Construction spending has one of the biggest impacts on economic indicators, as the construction industry is huge.  Construction spending gives us a picture of how well the construction industry is doing in the economy.  Construction, as a major employer is tied to employment and to the housing industry statistics.  The value of construction includes key cost categories such as labor, materials, professional services, and overhead costs.

The following graph from the US Census Bureau shows the trend in construction spending.  The data report indicates that in February 2012, construction spending was at almost $809 Billion, +5.8% increase over February 2011 data.  This represented a $45 Billion increase in construction spending year over year.  Private construction spending accounted for almost a $49 Billion net increase, while public construction spending dropped by nearly $4 Billion.

Overall, the construction industry is on the road to recovery it seems, but still not near the highs of over $1.2 Trillion in construction spending back in 2006.

Value of New Construction Chart


Strategy Plan One

http://strategyplanone.com

Business information, resources and tips for the entrepreneur

How do you like those Apps? App Sales [infographic]

Strategy Plan One                                                                                                                     

April 9, 2012 

App Sales

It is interesting to observe the app sales war play itself out across the top platforms, with the notable Blackberry, iPhone and Android companies and developers jockeying for customer revenue.  Even though Blackberry (BB) reports have not been favorable of late, take note of the impressive sales data around BB app sales.  Where BB lacks in volume of apps for its platform, it makes massive ground in the sales per app & return on investment per app.

This infographic from BlogBerry.de highlights data from the three most popular platforms:

  • BB: 70,000+ Apps; Over 6 Million downloads per day
  • iPhone: 500,000 Apps; 66.2% are paid apps; 4 times the Android app sales
  • Android: Over 400,000 Apps available; 79.3% of Apps have been downloaded less than 100 times

App sales - RIM, Apple, Android How they Compare

Strategy Plan One

http://strategyplanone.com

Business information, resources and tips for the entrepreneur

© 2012 Strategy Plan One

Franchise Statistics and Opportunities in the US Favorable [infographic]

Strategy Plan One

April 8, 2012 

Franchise Statistics

Franchised opportunities are brilliant options for entrepreneurs who want to invest in a turn-key operation, join and enjoy the fruits of a recognized brand, and experience a whole support team behind the venture.  Franchises are big business and account for close to 800,000 business establishments in the US alone.  Everywhere you turn in your community, in your town or city, you will encounter a franchised opportunity, offering you products and services.

McDonald’s, Subway, Pizza Hut, Pearle Vision, Hampton Inn & Suites, 7-11, and H&R Block franchises hammer the consumer with multiple locations and big advertising campaigns to ensure our brains are wired into recognized brands, wherever we go.  Some of these factors make it very challenging for entrepreneurs to enter the markets with their own individual start-up brands.

Franchise Statistics – Infographic

MGD Marketing has developed and distributed this infographic on franchise statistics and outlook in the US.  Here are some key points from most recent year of statistics (2011):

  • $1.3 Trillion in Sales across all franchises (2007 US Census Bureau) 
  • Over 784,000 establishments
  • 7.8 Million employees; growth in number of employees 3 years straight
  • Output:  $740 Billion
  • Number of Lodging franchises experiencing the highest growth 2010-2011
  • Both Franchisors and Franchisees experience similar challenges with access to credit, same-store sales, and competition

Franchise statistics

Strategy Plan One

http://strategyplanone.com

Business information, resources and tips for the entrepreneur

© 2012 Strategy Plan One

Social, Mobile, Cloud Gaming – Trends in the Video Game Industry

Strategy Plan One

April 3, 2012 


video game industryVideo Game Industry

Social media, online, streaming, and new platforms are all factors that play into the rapidly changing video game industry.  Many video game industry strategies are continuing to build on trends around social media sites, development of new tablet, mobile, handheld and console devices, and faster streamlining internet connections.


Posed to be a $65-80 Billion industry per year in 2012 and 2013, the emphasis in the video game industry continues on developing apps and games for mobile devices, while still not losing focus on console gaming with PS4 and Xbox 720 slated to début late 2013 or early in 2014.


Social Gaming

Building off the social gaming successes of companies like Zynga and Playfish, developers will continue to tie into the building user base of social media sites, now well over 1 Billion users.  However, users and developers are aligning for a far richer, deeper social gaming experience.


Last December, Zynga approached a $1 Billion valuation based on valuation tied to the hundreds of millions of social media users who flocked to their “free” games.  Zynga is one of those companies that speculated around revenue generation of a massive base of users.  Solid revenue generating models are developed once companies reach this stage to give assurances to investors.  In most social gaming sites, significant revenues are generated from advertising, rather than pay per use for gaming, and those models will be changing.


Offering More Free Access / Micro Payment Models

The movement is not away from free access, but more towards more free.  The objective of many online entertainment gaming companies is to accumulate as many users as possible, and thus, valuation of these sites increase.


Revenue models from gaming companies now include “pay by extra-feature”, or added features by subscription.  These tactics, sometimes referred to as “micro-payment” models tap into a user market willing to pay a very low monthly fee for gaming access.


Valuation of website inclines with the number of unpaid or paid subscribers.  The economic and business value of high volumes of potential consumers is prized by investors.


video game industryMobile Gaming Will Dominate

The mobile and tablet gaming industry is increasing at a good pace, with reference to Nielsen’s annual U.S. Gaming: A 360° View survey (March 2012).  Marketing research firm M2 Research is predicting that the mobile gaming market will blow past the $6 Billion mark in 2012.


The use of mobile platforms will continue to grow at alarming rates.  2012 will see the app and game market develop around the new iPad 3, Sony’s PS Vita, and many mobile devices utilizing the Android operating system.


Android Operating System (OS) gaming is dominated by users in the 25-34 age brackets.  Android is gaining massive strides as the dominate operating system for mobile smart phone and tablet devices.  By February 2012, 450,000 apps were available for Android.   iPhone gaming has appeared to be penetrating evenly across all age segments.


Cloud Gaming

Cloud gaming, which is essentially “Gaming on Demand”, will continue to build in 2012, as it makes it easier and faster for all gamers to connect from any type of mobile to console device.   Cloud streaming gaming is considering similar along the lines of streaming movies.  Here is a YouTube video on Cloud Gaming and its appealing direct, instant streaming features to video game enthusiasts.


The gaming industry will generate much interest over the next few years.  Entrepreneurs, developers, and businesses in the industry should keep a frequent eye on the rapidly changing gaming landscape.

Strategy Plan One

http://strategyplanone.com

Business information, resources and tips for the entrepreneur

© 2012 Strategy Plan One

Oil Prices & Impacts on the US Economy and YOU [Infographic]

Strategy Plan One

April 1, 2012 

The price of crude oil, and consequently the price of everything, is rapidly increasing.  This infographic, courtesy of fuelfreedom.org highlights the impacts of oil prices.

Some fact and impacts of oil prices:

  • 10 out of the last 11 recessions occurred after an increase spike in oil prices
  • $330 Billion – US net outflow for foreign oil
  • Economists projecting 2012 to have the highest gas prices in history
  • Estimation of up to $200 per barrel of oil if Iran relationship worsens
  • Highest impacts would occur to lower – middle income earning families

Time for increased emphasis on alternative energy sources and technologies?  You bet.  Tough economic times an challenges such as these open the doors further to business opportunities around alternatives and green clean energy.

infographic

Strategy Plan One

http://strategyplanone.com

Business information, resources and tips for the entrepreneur

© 2012 Strategy Plan One

Hopping US Retail Statistics Around Easter

Strategy Plan One

March 31, 2012 

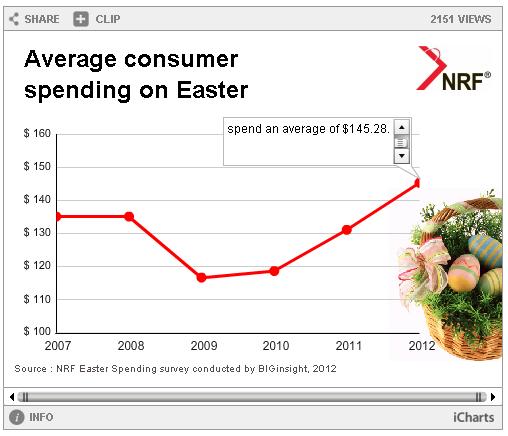
The National Retail Federation (NRF) has released some estimated retail statistics for US consumer spending in the 2012 Easter period.   This could be noted as more positive economic indicators, with projected spending to increase for this year’s season.  Retail entrepreneurs and business owners should tune-in to lucrative events in the annual calendar, as all pose to be potentially lucrative if you tap into some niche retail areas.

Here are some highlights on 2012 estimated US retail spending around Easter, based on a NRF survey:

  • Estimated average spending on retail merchandise, food, candy: $145.28
  • 2012 estimated average spending is up by +11% over 2011 ($131.04)
  • Total estimated retail spending for Easter 2012:  A big $16.8 Billion

Easter Calendar - spending

Here are the biggest categories in a breakdown of the estimated retail spending around Easter 2012:

  • Fashion & Accessories:  $3.0 Billion
  • Easter Candy:  $2 Billion
  • Easter meals & food:  $5.1 Billion
  • Easter gifts & cards:  $2 Billion

It is interesting to note that the average estimate spending is $44.34 for Easter meals, $20.57 for Easter Gifts, $10.50 on flowers, $9.07 for Easter decor, and from the half that buy greeting cards, an average of $7.04 on greeting cards.

Easter Shopping

Some interesting trends are highlighted in this NRF survey around how and where consumers will shop:

  • 63.5% will shop at the local discount store
  • 42.6% will shop at a department store for gifts; highest percent in the survey’s history
  • 8.7% will shop online, represents a 4% increase over last year
  • 25.4% will shop at a specialty retail store

Similar to other calendar events, Easter consumer retail spending can bring significant revenues to your business, if you target customers in niche areas.  If you are in retail in these areas, do not overlook the power of retail during special periods.  Plan well in advance for periods of retail opportunities.

Strategy Plan One

http://strategyplanone.com

Business information, resources and tips for the entrepreneur

© 2012 Strategy Plan One

Trends in the Growing Online Wine Sales Industry (infographic)

Strategy Plan One

March 30, 2012 

Here are some interesting statistics and trends in the online wine sales industry in this infographic, courtesy of  Neo Mammalian Studios.  Tapping into the growing online wine sales market can be very lucrative.  One company, Garagiste, with sales of $30M per year, started on an initial investment of $500.

Statistics and Trends:

  • Lot 18 – over half a million members
  • Average range of prices for a bottle of wine online:  $20 – 37
  • Average range of discounts for wine online: 30 – 51% 
  • Page views for at least two online wine sales companies: over 600,000 per month (Jan 2012)

wine trends - online wine sales

Strategy Plan One

http://strategyplanone.com

Business information, resources and tips for the entrepreneur

© 2012 Strategy Plan One

Mommy Blogger Domination [Infographic]

Strategy Plan One

March 29, 2012 

The big business world of Mommy Blogging is illustrated brilliantly in this infographic below, courtesy of infographicsarchive.com.

Mommy blogger huge numbers:

  • 4.2 Million Mommy bloggers and growing  
  • 33% of bloggers are Moms
  • Social Media – 79% of Moms are active on social media
  • Over 81 Million women active in social media on a weekly basis
  • US Moms spend $2.1 Trillion per year

mommy blog

Strategy Plan One

http://strategyplanone.com

Business information, resources and tips for the entrepreneur

© 2012 Strategy Plan One

Age Statistics and Breakdown on Social Media Sites (Infographic)

Strategy Plan One

March 17, 2012 

Social Media Statistics

Different social media sites are used by different age groups for differing purposes.  Whether you use social media sites for business or other social means, you may find after reviewing stats and infographics such as this, you may want to alter or focus attention on sites that cater to certain age groups.

Courtesy of Pingdom.com and data from Google Ad Planner, here is an interesting age distribution breakdown of users on different social media sites.

Social Media Statistics – Infographic

Age Distribution Across Social Networking Sites


From the above graphic, you can see that younger users dominate sites such as Bebo and MySpace and Xanga.  The more mature age groups, possible more engaged in using social media for career or business purposes, are the majority users on Twitter, Digg, Delicious, LinkedIn, and Classmates.

Targeting and the messaging around your products and services, or for other social means, is critically important.  Knowing statistics around age demographics on social media sites will help shape your marketing strategy and assist you to get the right message to the right target market.


Strategy Plan One

http://strategyplanone.com

Business information, resources and tips for the entrepreneur

© 2012 Strategy Plan One